2026.06.04
Executive Summary
This white paper presents a genetic testing technology developed by seeDNA Institute of Genetic Medicine that analyzes individual ancestry composition from 700 single nucleotide variant (SNV) loci. Built upon the 1000 Genomes Project reference dataset (1) and powered by a multinomial logistic regression algorithm, the model computes the probability of an individual belonging to each of 13 globally defined populations.
Large-scale validation using 6,752 buccal epithelial samples in Japan achieved an overall model accuracy of 82.4%, with a Japanese (JPT) identification precision of 1.000 and F1-score of 0.950. The analysis of population-level ancestry composition revealed that the mean Japanese-specific genetic component (East Asia 1) among subjects was only 39.99%, while other East Asian components—Korean-associated (16.81%), Chinese (11.85%), and Vietnamese (7.04%)—collectively accounted for 35.70%. The distribution analysis further showed that only approximately 1.91% of individuals carried 90% or more Japanese-specific genetic patterns, while 20.01% exhibited less than 10% Japanese-specific elements (12).
Background
2.1 Genetic Origins of Modern Japanese: The Tripartite Model
Understanding the genetic composition of modern Japanese requires the tripartite population model established by recent ancient genome analyses. Cooke et al. (2021) demonstrated through ancient skeletal genome sequencing that three distinct waves of genetic influx shaped the Japanese archipelago, superseding the earlier dual-structure hypothesis (2).
- Layer 1: Jomon Lineage
The indigenous hunter-gatherer population that inhabited the Japanese archipelago from approximately 16,000 years ago. Gakuhari et al. (2020) revealed through ancient Jomon genome sequencing that this population represents a deeply diverged lineage distinct from continental East Asian populations (3). The Jomon genetic legacy persists as a foundational element in modern Japanese genomes, with particularly elevated proportions observed in Okinawa and the Tohoku region. - Layer 2: Yayoi Lineage
The agricultural migrant population that arrived from Northeast Asia approximately 3,000 years ago, introducing wet-rice cultivation to the Japanese archipelago. The Yayoi migrants, through large-scale population movement and subsequent admixture with the indigenous Jomon population, contributed the largest single genetic component to modern Japanese ancestry. - Layer 3: Kofun-Period East Asian Lineage
A third wave of genetic influx from the East Asian continent (primarily from the Korean Peninsula and China) during the Kofun period, approximately 1,700 years ago. This layer further complexified the admixture of the preceding two strata (2). Yamamoto et al. (2024) validated this tripartite model at scale by integrating 171,287 Biobank Japan samples with 22 ancient genomes (4).
2.2 Scientific Foundation of Genetic Ancestry Estimation
Genetic ancestry estimation technology has advanced rapidly in forensic and population genetics. Phillips (2015) provided a comprehensive review of bio-geographical ancestry (BGA) inference, systematizing ancestry-informative marker (AIM) selection strategies (5). Kidd et al. (2014) developed a 55-AISNP panel validated across 73 populations (6), and de la Puente et al. (2021) constructed a 115-AIM-SNP panel for the VISAGE consortium (7).
Building upon these foundations, seeDNA independently curated 700 SNV loci—several times the density of existing panels—to enable high-resolution sub-classification within East Asian populations (Japanese, Korean, Chinese, Vietnamese).
Technical Framework and Analytical Methods
3.1 Reference Dataset: 1000 Genomes Project
The training data for this model were derived from the 1000 Genomes Project Phase 3, encompassing whole-genome sequences of 2,504 individuals across 26 global populations (1). The model employs a 13-population classification system derived from five superpopulations, as detailed in the table below.
| Region | Population | Code | Ethnic Group / Area |
|---|---|---|---|
| Africa | Africa 1 | AFR | ASW, ACB, ESN, GWD, LWK, MSL, YRI |
| East Asia | East Asia 1 | JPT | Japanese (Tokyo) |
| East Asia 2 | KHV* | Korean-associated / Kinh Vietnamese | |
| East Asia 3 | CHB | Han Chinese, Northern (Beijing) | |
| East Asia 4 | CDX/CHS | Dai / Southern Han Chinese | |
| Europe | Europe 1 | GBR | British |
| Europe 2 | FIN | Finnish | |
| Europe 3 | IBS | Spanish (Iberian Peninsula) | |
| Europe 4 | TSI | Italian (Tuscan) | |
| Europe 5 | CEU | Northern/Western European | |
| South Asia | South Asia 1 | SAS | BEB, GIH, ITU, PJL, STU |
| Americas | America 1 | MXL/CLM | Mexican / Colombian |
| America 2 | PEL/PUR | Peruvian / Puerto Rican |
*In the production model, the KHV reference cluster has been relabeled “Korean-associated” based on observed allele frequency proximity to Korean populations in the service dataset.
3.2 SNV Selection Criteria
SNV selection followed stringent criteria to maximize predictive power.
- Allele frequency divergence (delta values): SNVs exhibiting pronounced frequency differences across populations were prioritized. For example, rs2814778 exhibits a delta value of 0.994 between African and non-African populations (7).
- Linkage disequilibrium avoidance: A minimum inter-SNV distance of 1,000,000 bp (≈1 cM) was enforced to eliminate informational redundancy (6).
- Additive genotype encoding: Genotypes were converted to numerical values (0 = homozygous reference, 1 = heterozygous, 2 = homozygous alternative) for model input.
3.3 Dimensionality Reduction: Principal Component Analysis
PCA was performed following the eigenanalysis framework established by Patterson et al. (2006) (8). The first four principal components captured the following population boundaries.
● PC1: Separated African populations from all others
● PC2: Distinguished East Asian from European clusters
● PC3: Extracted South Asian populations
● PC4: Delineated American (AMR) populations
While approximately 200 SNVs suffice for superpopulation-level separation, the 700-locus density adopted in this model proved essential for sub-classification within East Asia (Japanese, Korean, Chinese, Vietnamese).
3.4 Machine Learning Model: Multinomial Logistic Regression
Initial experiments with random forest classifiers revealed severe overfitting (accuracy 0.695 on test data despite near-perfect training performance). Multinomial logistic regression was adopted as the final model, achieving accuracy of 0.805–0.824 with resolution of the overfitting problem. The model outputs a probability vector across all 13 populations for each individual, representing ancestry as a gradient rather than a categorical label.
3.5 Supplementary Analysis: Codon Usage Bias (CUBAP)
In addition to ADMIXTURE-based unsupervised ancestry estimation (9), supplementary validation was performed using the Codon Usage Bias Analysis Portal (CUBAP) developed by Hodgman et al. (2020) (10). CUBAP identified statistically significant inter-population codon pairing differences in 35.8% of genes across the 1000 Genomes dataset.
Results
4.1 Model Prediction Accuracy by Population
The final multinomial logistic regression model achieved an overall accuracy of 82.4%. The table below presents population-specific performance metrics.
| Population | Precision | Recall | F1-score |
|---|---|---|---|
| Japanese (JPT) | 1.000 | 0.905 | 0.950 |
| African (AFR) | 1.000 | 0.993 | 0.996 |
| South Asian (SAS) | 0.990 | 1.000 | 0.995 |
| S. Chinese (CHS/CDX) | 0.800 | 0.780 | 0.790 |
| Vietnamese (KHV) | 0.875 | 0.700 | 0.778 |
| N. Chinese (CHB) | 0.643 | 0.857 | 0.735 |
| British (GBR) | 0.368 | 0.350 | 0.359 |
| N/W European (CEU) | 0.300 | 0.300 | 0.300 |
Japanese (JPT) precision of 1.000 indicates that every individual classified as Japanese by the model was correctly identified. The F1-score of 0.950 confirms robust performance balancing both precision and recall. African, South Asian, and Japanese populations exhibited the highest classification accuracy, while intra-European distinctions showed lower discrimination due to their closer genetic proximity and extensive historical admixture.
4.2 Mean Ancestry Composition of 6,752 Japanese Subjects
Analysis of 6,752 buccal epithelial samples collected from individuals residing in Japan revealed the following mean ancestry composition across the 13-population model (12).
| Rank | Ancestry Component | Mean Proportion | Percentage |
|---|---|---|---|
| 1 | Japanese (East Asia 1) | 0.3999 | 39.99% |
| 2 | Korean-associated (East Asia 2) | 0.1681 | 16.81% |
| 3 | Chinese / S. Han (East Asia 3) | 0.1185 | 11.85% |
| 4 | African (Africa 1) | 0.1064 | 10.64% |
| 5 | South Asian (South Asia 1) | 0.0929 | 9.29% |
| 6 | Vietnamese (East Asia 4) | 0.0704 | 7.04% |
| 7 | American (America 1) | 0.0172 | 1.72% |
| 8 | S. American (America 2) | 0.0143 | 1.43% |
| 9 | Spanish (Europe 3) | 0.0044 | 0.44% |
| 10 | N/W European (Europe 5) | 0.0026 | 0.26% |
| 11 | Italian (Europe 4) | 0.0024 | 0.24% |
| 12 | British (Europe 1) | 0.0018 | 0.18% |
| 13 | Finnish (Europe 2) | 0.0012 | 0.12% |
The results reveal that even among individuals residing in Japan, the mean Japanese-specific genetic component constitutes only 39.99% of the total ancestry profile. East Asian components collectively account for 75.69% of the average profile, consistent with the geographical and historical context of the Japanese archipelago.
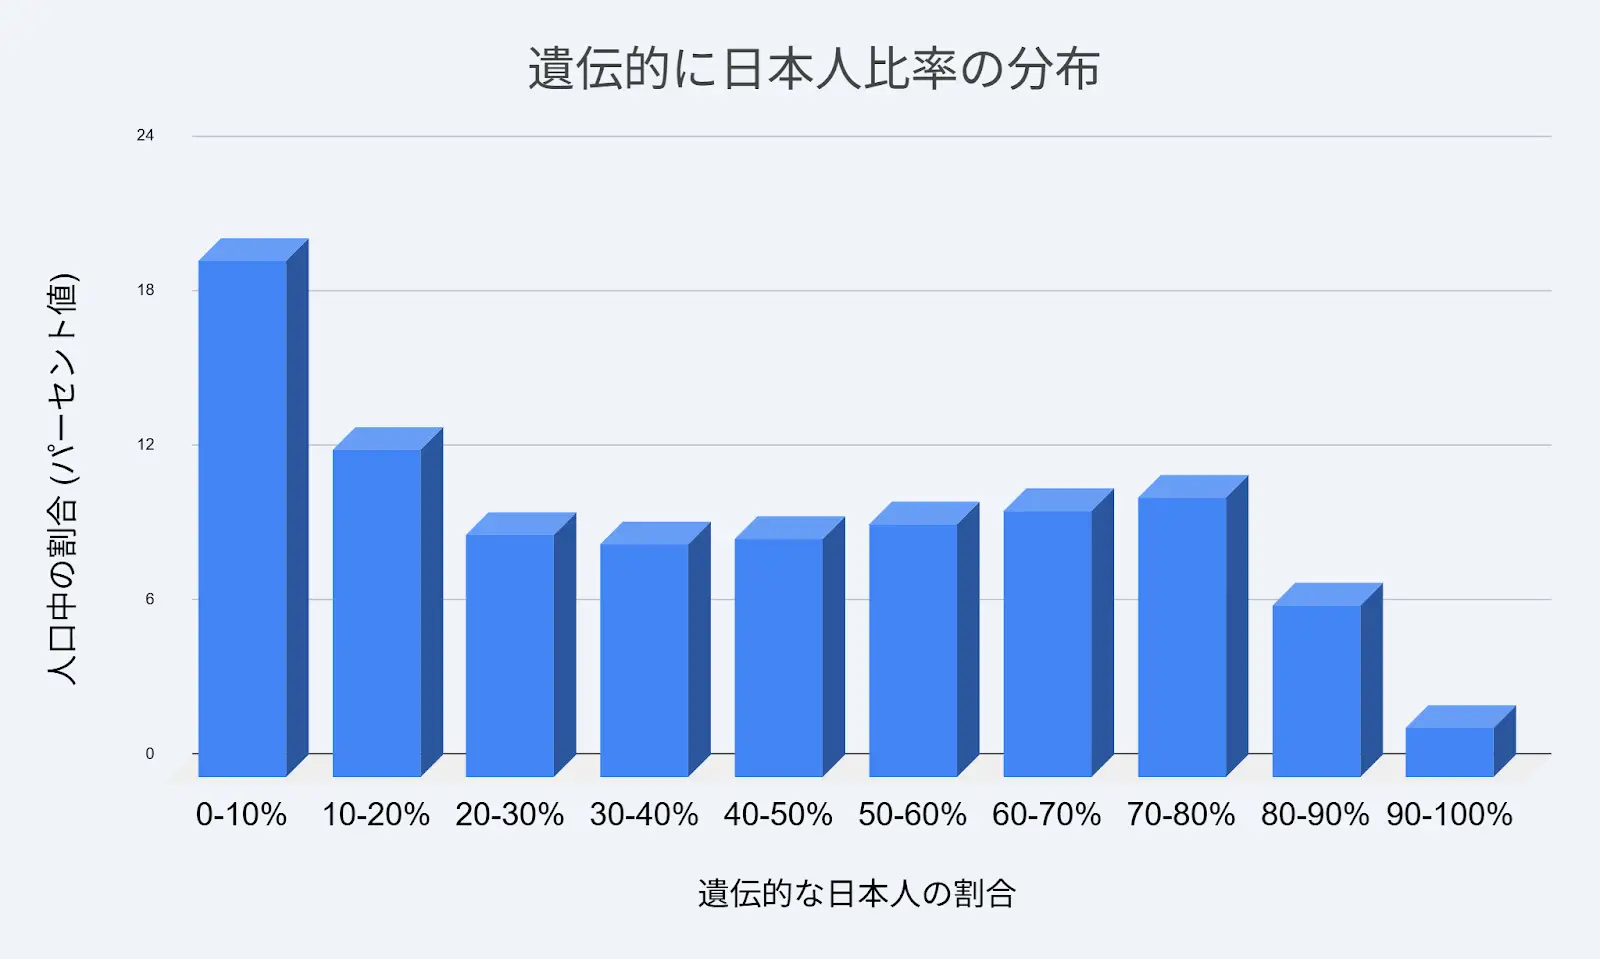
4.3 Distribution of Japanese-Specific DNA Profile Ratio
The table below presents the population distribution of the Japanese-specific genetic component (East Asia 1 proportion) among the 6,752 subjects (12).
| Japanese DNA Profile Ratio | % of Population | No. of Subjects |
|---|---|---|
| 0–10% | 20.01% | 1,351 |
| 10–20% | 12.68% | 856 |
| 20–30% | 9.42% | 636 |
| 30–40% | 9.05% | 611 |
| 40–50% | 9.26% | 625 |
| 50–60% | 9.82% | 663 |
| 60–70% | 10.34% | 698 |
| 70–80% | 10.86% | 733 |
| 80–90% | 6.66% | 450 |
| 90–100% | 1.91% | 129 |
Key finding: Only 1.91% of subjects (129 individuals) carried 90% or more Japanese-specific genetic patterns, while 20.01% of subjects (1,351 individuals) exhibited less than 10% Japanese-specific elements. The distribution is notably U-shaped rather than normally distributed, reflecting the complex admixture history of the Japanese archipelago, where cumulative waves of migration over tens of thousands of years have created a genetically heterogeneous population.
4.4 CUBAP Supplementary Validation
Codon usage bias analysis confirmed that codon pairing frequency alone achieves 100% accuracy in predicting East Asian population origin and 98.8% accuracy for African populations (10), independently supporting the validity of the SNV-based ancestry model.
Discussion
5.1 Clinical Implications: IRGM Gene and Crohn’s Disease
Genetic ancestry estimation serves as a foundation for precision medicine. Brest et al. (2011) demonstrated that the synonymous SNP rs10065172 (c.313C>T) in the IRGM gene disrupts a miR-196 binding site by abolishing a critical CTG pair, leading to deregulation of IRGM-dependent xenophagy and elevated Crohn’s disease risk (11).
Notably, this disease association exhibits significant inter-population variation: European populations show strong association with Crohn’s disease risk, whereas East Asian and African populations show attenuated effects. CUBAP analysis confirmed that East Asian and African populations exhibit inherently lower CTG pairing frequencies in the IRGM gene (10), elucidating the genetic basis for differential disease susceptibility across ancestral backgrounds.
5.2 Ethical Considerations
The 1000 Genomes Project was conducted under rigorous informed consent, with deliberate exclusion of isolated and vulnerable populations to prevent stigmatization (1). seeDNA maintains a communication framework that emphasizes genetic ancestry as a probabilistic gradient—not an absolute ethnic boundary—to ensure that results are interpreted without reinforcing prejudice or discrimination.
Conclusions
This white paper has presented the theoretical framework, analytical methodology, and validation results for seeDNA’s 700-SNV genetic ancestry composition analysis technology. The principal findings are as follows.
- A multinomial logistic regression model trained on the 1000 Genomes Project reference dataset achieves 82.4% overall accuracy in predicting ancestry across 13 global populations, with Japanese (JPT) identification attaining precision of 1.000 and F1-score of 0.950.
- Large-scale analysis of 6,752 individuals residing in Japan quantitatively demonstrated the extensive genetic diversity within the Japanese population. The mean Japanese-specific component was only 39.99%. Only approximately 2% of individuals carried 90% or more Japanese-specific genetic patterns, while approximately 20% exhibited less than 10% (2)(4)(12).
- The IRGM/Crohn’s disease case study illustrates that accurate ancestry profiling directly informs individualized disease risk assessment and precision medicine (10)(11).
Genetic ancestry is not an absolute boundary but a gradual continuum of allele frequencies. The information encoded in individual DNA represents a record of tens of thousands of years of human migration and admixture—and understanding one’s genetic roots constitutes both a rediscovery of identity and a scientific step toward protecting future health.
References
(1) 1000 Genomes Project Consortium. A global reference for human genetic variation. Nature 526, 68–74 (2015).(2) Cooke NP et al. Ancient genomics reveals tripartite origins of Japanese populations. Science Advances 7(38), eabh2419 (2021).
(3) Gakuhari T et al. Ancient Jomon genome sequence analysis sheds light on migration patterns of early East Asian populations. Communications Biology 3, 437 (2020).
(4) Yamamoto K et al. Genetic legacy of ancient hunter-gatherer Jomon in Japanese populations. Nature Communications 15, 9780 (2024).
(5) Phillips C. Forensic genetic analysis of bio-geographical ancestry. Forensic Science International: Genetics 18, 49–65 (2015).
(6) Kidd KK et al. Progress toward an efficient panel of SNPs for ancestry inference. Forensic Science International: Genetics 10, 23–32 (2014).
(7) de la Puente M et al. Development and Evaluation of the Ancestry Informative Marker Panel of the VISAGE Basic Tool. Genes 12(8), 1284 (2021).
(8) Patterson N, Price AL, Reich D. Population Structure and Eigenanalysis. PLoS Genetics 2(12), e190 (2006).
(9) Alexander DH, Novembre J, Lange K. Fast model-based estimation of ancestry in unrelated individuals. Genome Research 19(9), 1655–1664 (2009).
(10) Hodgman MW et al. CUBAP: an interactive web portal for analyzing codon usage biases across populations. Nucleic Acids Research 48(19), 11030–11039 (2020).
(11) Brest P et al. A synonymous variant in IRGM alters a binding site for miR-196 and causes deregulation of IRGM-dependent xenophagy in Crohn’s disease. Nature Genetics 43(3), 242–245 (2011).
(12) seeDNA. DNA Roots Ancestry Analysis Service (internal study, n = 6,752, 2026).
Disclaimer: This white paper reports research findings of seeDNA Institute of Genetic Medicine and does not constitute medical advice. Genetic test results are probabilistic estimates; consultation with qualified healthcare professionals is recommended for medical decision-making.
seeDNA Institute of Genetic Medicine
seeDNA Institute of Genetic Medicine holds international quality certification ISO9001 and the Privacy Mark (Pマーク) for personal information protection, ensuring the highest standards of accuracy and confidentiality in all genetic testing services.
Whether you have questions about ancestry composition, health risk assessment, or DNA-based family relationships, our genetic specialists are ready to support you.
【Free Consultation by Specialist Staff】

For any inquiries, please feel free to
contact our toll-free number.
\Open 7 days a week/
Hours: Mon–Sun 9:00–18:00
(Excluding public holidays)